AFW 1.1.4 — Investment Principles — #4: Deption of the Rate-of-Return
4. Deception of ROR
“Lies, damned lies, and statistics.” ―Benjamin Disraeli
Resources
Average Rate-Of-Return and Volatility
Long-term average rates-of-return are important. However, if the rates-of-return are similar in two mutual funds, then the one with lower volatility may be a better choice, as it doesn't have to "work as hard" to maintain its average. Lower volatility also reduces the psychological stress of the client. (This concept applies to fees/annual expenses, as well.)
- Year 1: Invest $100,000
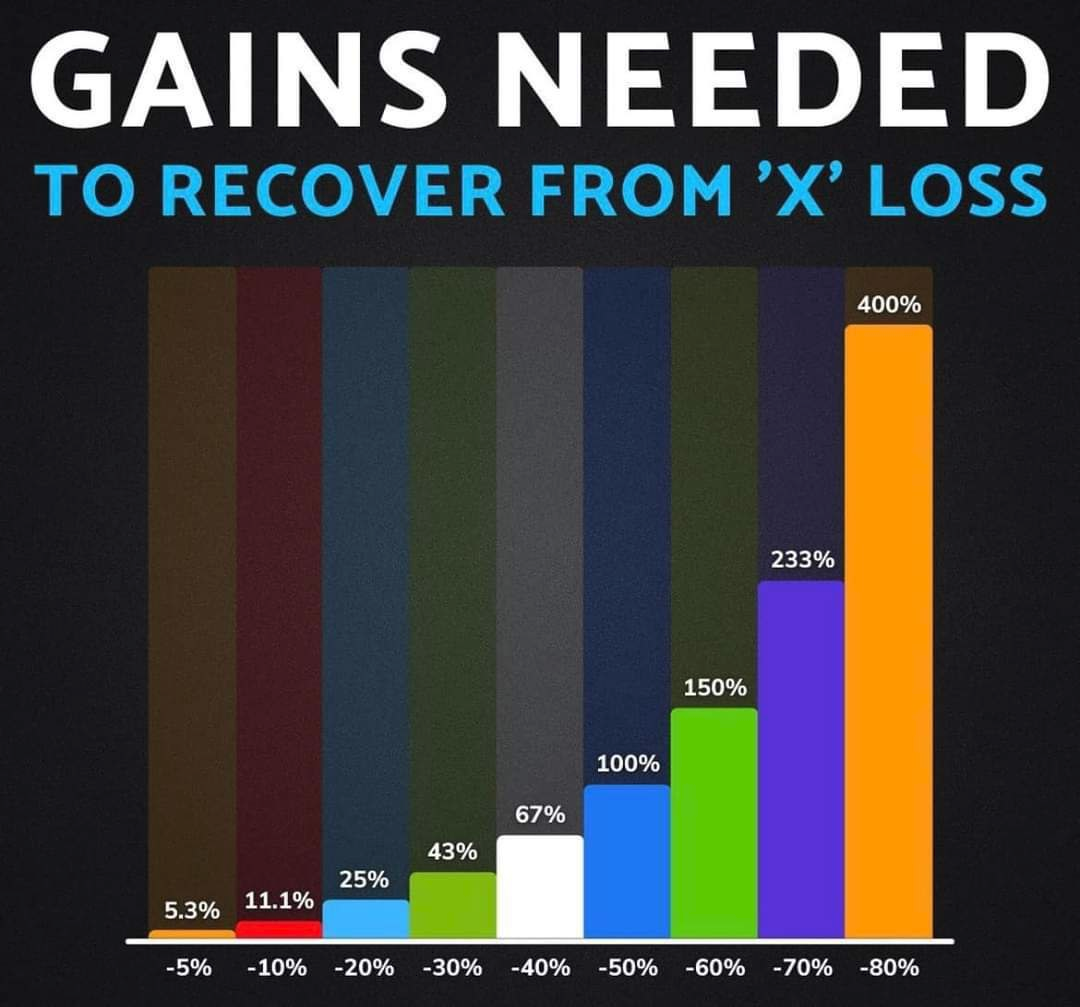
- Year 2: Lose -50% (new balance is $50,000)
- Year 3: How much return do you need the get back to your original $100,000?
Answer
You need $100%! (not 50%)
Fallacy of the Hypothetical
Please do not let the title of this principle mislead you. Hypotheticals are one of the most powerful tools you have in your arsenal. Often however, proponents of fixed-accounts will use a negative history to "demonstrate" that the stock market is volatile or doesn't perform well. This is wrong.
Start/End Date Deviation
When running a hypothetical, especially one that initially appears to have a low return, check the Start/End Date Deviation.
Tip
- For a more accurate historical performance run all available rolling-periods. And show the median of all those periods.
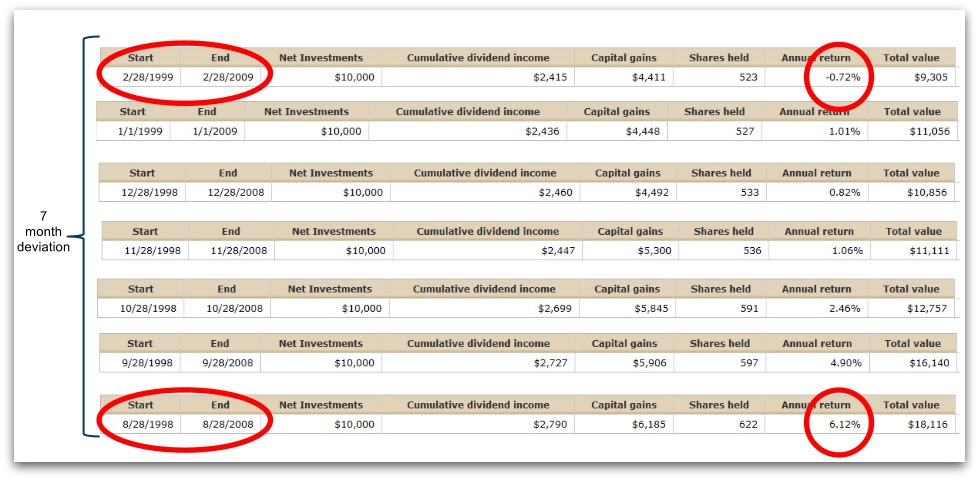
Looking at the first row of the above statistic one could infer that the ICA has been a poor investment for those 10 years (this is the worst 10-year perdiod ever for the ICA, by the way).
Not so fast...
That row only compares two days (Feb 28 1998, and Feb 28 2008) out 3,650 days! The other 3,648 days in between are ignored. (This is the fundamental problem of illustrations that are not rolling periods.)
Changing the Start/End dates by just seven months, improves the 10-year average by +6.84%, from -0.72% to 6.12%!
A Tool to Handle Objections
You can use this principle to handle objections. For example, if someone states that the last 10 years the market has been poor, your response could be...
Script
Well, it depends how you run the numbers. We call it Start/End Date Deviation. For example, if you analyze one of our mutual funds, the ICA, from Feb 1998 to Feb 2008 the average return is -0.72%. But if you shift the dates by just 7 months from Aug 1998 to Aug 2008, then the 10-year average return is 6.12%.
A 7 month deviation made almost a 7% difference over 10 years!
Resource
- Read Nick's NMS 17 - The mindless tyranny of benchmarks